By Kalle Hirvonen, Alemayehu Seyoum Taffesse and Ibrahim Worku
Seasonality in food consumption patterns in developing countries attracted considerable research attention in the 1990s and early 2000s. Nutritionists and other researchers documented substantial intra-annual fluctuations in children’s and adults’ anthropometric measures. Economists found how various welfare indicators, such as consumption, incomes, and prices, moved together with the agricultural seasons.
Despite growing interest in diet quality in developing countries, little evidence exists on how diet quality changes with the agricultural seasons. This research revisits seasonality by assessing how the quantity and quality of diets vary across agricultural seasons in rural and urban Ethiopia.
Background
More than 80 percent of Ethiopians reside in rural areas and depend on agriculture as their main source of income. Ethiopian farmers rely largely on rain-fed agriculture, and therefore agricultural production in the country takes place in seasonal cycles. Urban areas depend on food produced in the rural areas. As a consequence, food prices fluctuate across the seasons, causing the seasonality of agricultural production in rural areas to affect the food consumption patterns of the smaller urban population of Ethiopia.
In addition to weather-cycles, religion plays a central role in shaping diets during a calendar year in Ethiopia. Therefore, it is importat to take these religious fasting events into account when analyzing seasonality in this context.
Data and diet measures
The primary data source used for the analysis is the Household, Consumption and Expenditure Survey (HCES), collected by the Central Statistical Agency (CSA). The data collected between 8 July 2010 and 7 July 2011, provide nationally representative data for each month over one calendar year. This offers a unique opportunity to document seasonal fluctuations in household diets both in terms of quantity and quality.
Household diets were assessed over a period of 7 days, using daily per capita calorie intake as the measure of diet quantity. The quality of diets was assessed using the Household Diet Diversity Score (HDDS). A higher diet diversity score implies that the household consumes a diet that has more diversity in terms of foods consumed and, by extension, in terms of macro- and micronutrients.
Findings
The results showed that compared to the post-harvest season, average per capita calorie intake among rural households is about 10 percent lower during the lean season (see Figure 1). Rural households are seen to enjoy better diets in terms of calories consumed.The mean daily calorie consumption for rural households is 2,444 kilocalories per capita, whereas urban households consume, on average, 2,287 kilocalories per capita. This difference in average calorie consumption likely reflects higher average calorie requirements in rural areas partly due to the demands of more physical labor. More expensive sources of calories in urban areas also may play a role in these different calorie consumption patterns.
Figure 1: Seasonal patterns in mean daily per capita calorie intake, by rural/urban
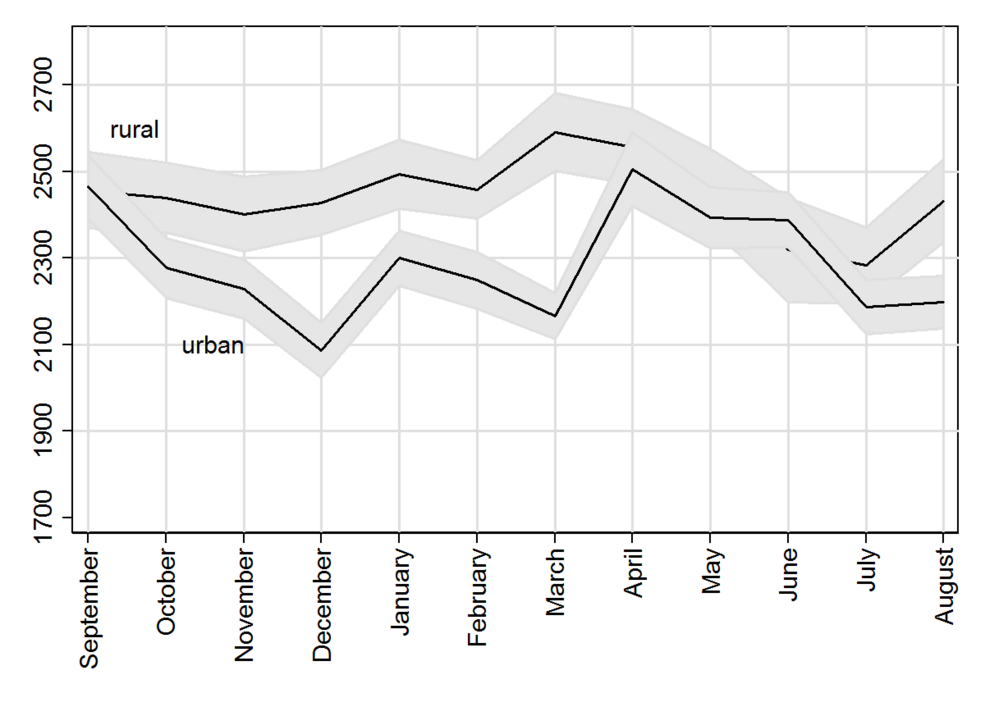
Notes: The vertical axis measures daily per capita calorie consumption of households. The solid line gives the mean for each calendar month. The grey areas represent 95% confidence intervals.
Source: HCE 2010/11 data from CSA.
Moreover, the average diet diversity score for rural households in the lean season is nearly 7 percent below the annual mean (Figure 2) However, due to seasonal changes in the composition of diets (Figure 3), the diet diversity score increases towards the end of the lean season as a greater diversity of foods is consumed. The diets of urban households follow similar seasonal patterns.
Figure 2: Seasonal patterns in mean household diet diversity score, by rural/urban
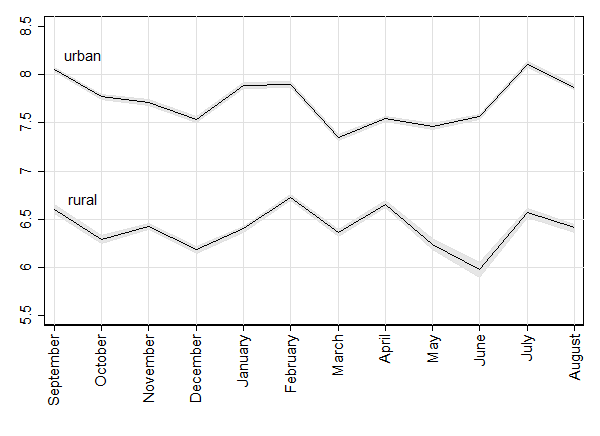
Notes: The vertical axis measures the number of food groups consumed by households. The solid line gives the mean for each calendar month and the grey areas represent 95% confidence intervals.
Source: HCE 2010/11 data from CSA.
Figure 3: Percentage share of per capita calorie intake from non-cereal sources by month, by rural/urban
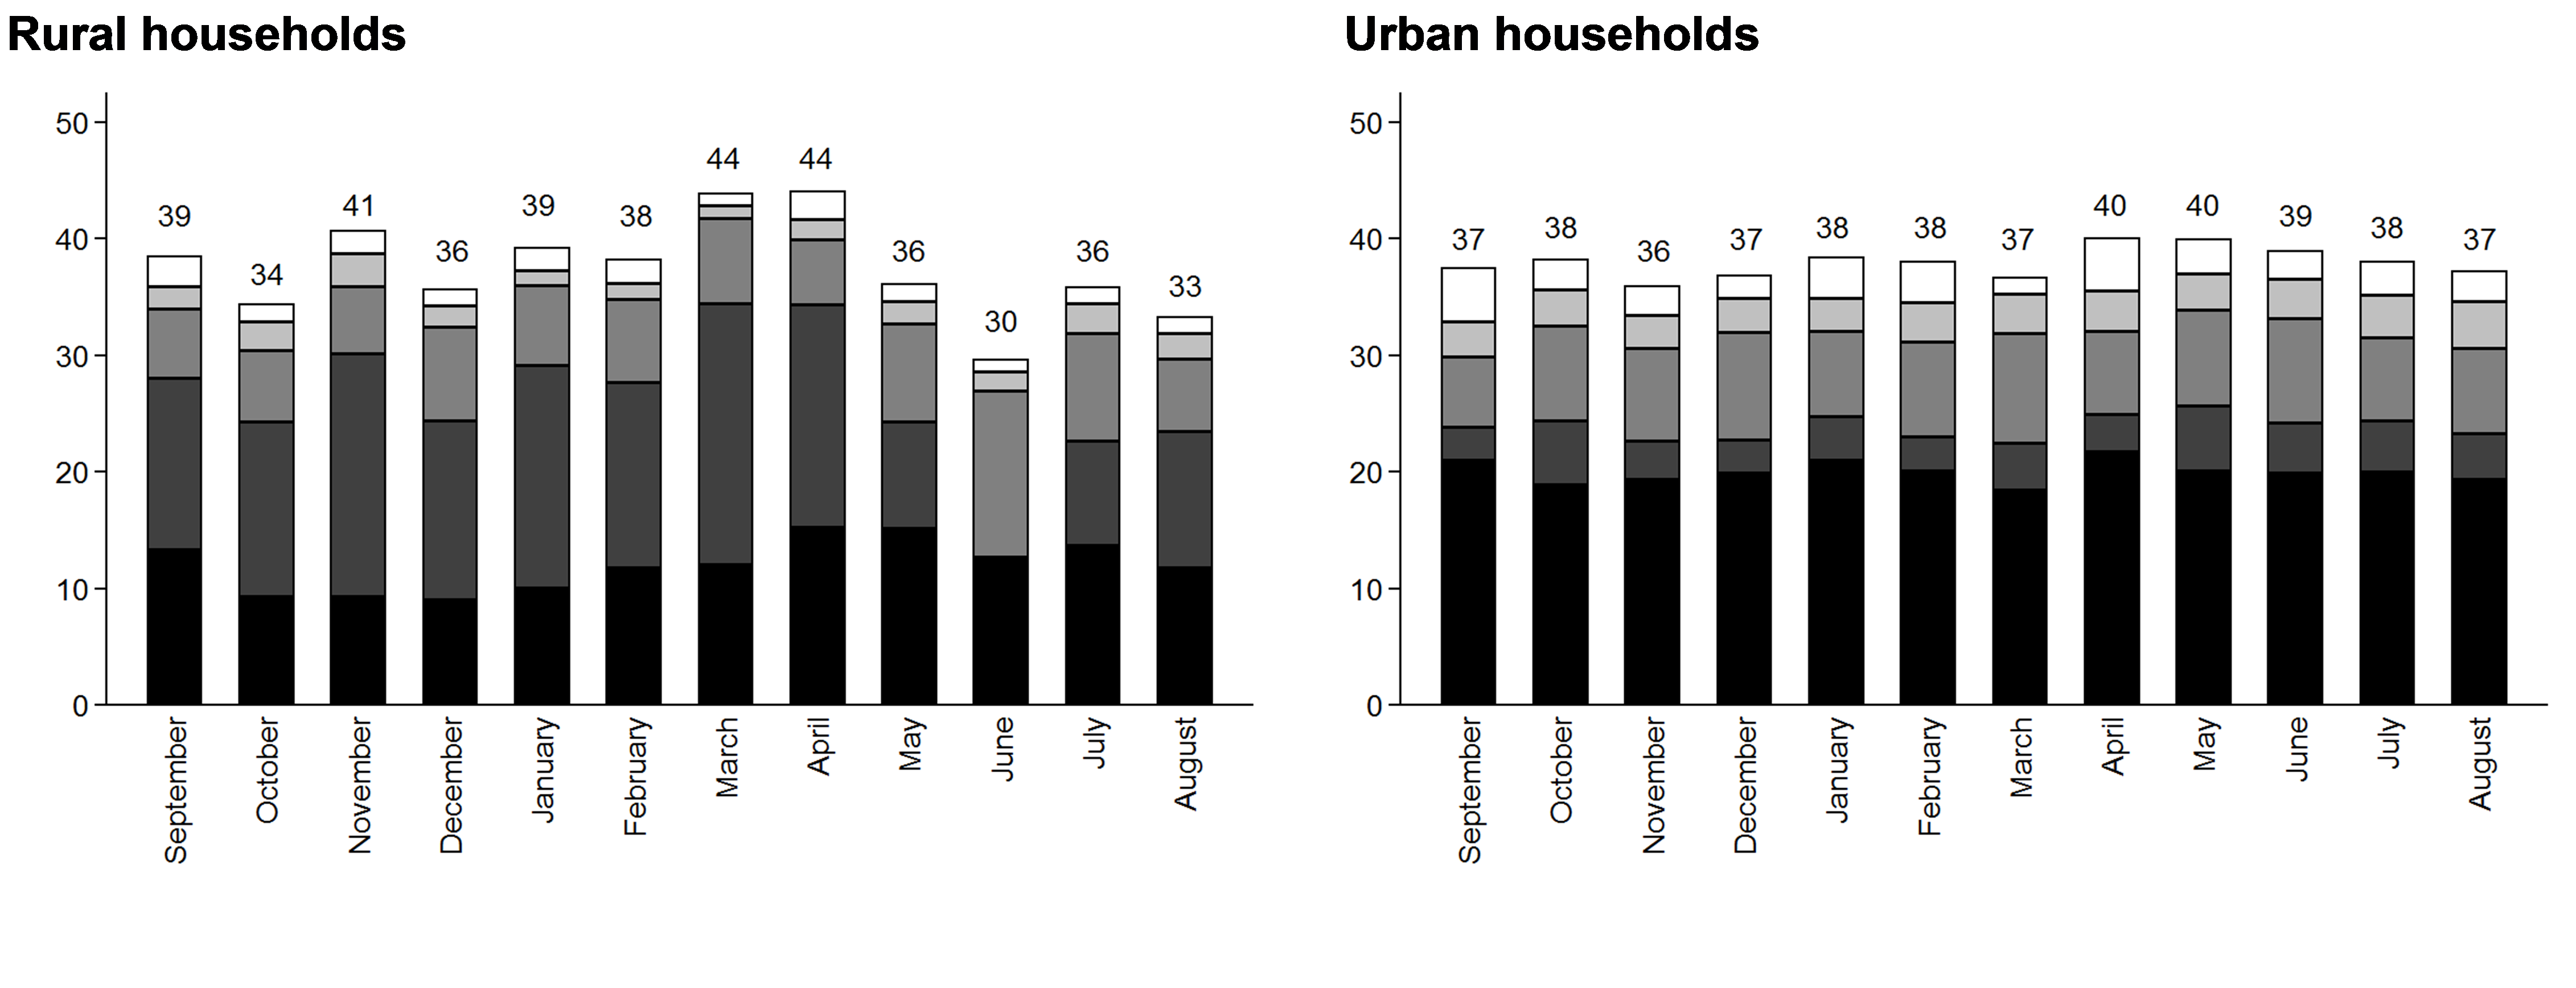
Notes: The vertical axis measures the percent of daily per capita calories in each month coming from different food groups. The number at the top of each bar gives the percent of calories coming from non-cereal foods. Cereal foods constitute the omitted category: the percent of calories coming from cereals each month can be obtained by subtracting the number at the top of the bar from 100. The ‘other sources’ category includes oils and fats, sugar and honey and miscellaneous items.
Source: HCE 2010/11 data from CSA.
Conclusions and policy implications
The paper provides evidence that the quantity and quality of households’ food consumption remain subject to significant intra-annual variations in Ethiopia. Agricultural production in most areas of the country is based on only one rain-fed agricultural season. Together with inadequately integrated food markets, this renders large parts of the country vulnerable to the seasonality of the local agricultural production. Policies that promote the expansion of irrigation (so that food can be produced in off-seasons) and market access, are likely to increase the quantities of food produced in the country but also make households – and food markets – less dependent on the main agricultural season.
An interesting finding of this research is that the composition of diets varies across the seasons. As a result, the diet diversity score is relatively high at the height of the lean season – a period characterized by lowest calorie intake in rural areas. Previous literature has considered diet diversity as a good indicator of food security. This decoupling of the diet quantity and diversity measures observed in the lean season suggests that the seasonal validity of this indicator cannot be taken for granted. Indeed, at least in Ethiopia and other similar contexts, researchers should, as a matter of routine, measure food security through different indicators, not only through the diet diversity score.
To read more about this research, please refer to ESSP Working Paper 74. You may also subscribe to regular updates on ESSP’s work and its quarterly newsletter.
ESSP is a collaborative program undertaken by IFPRI and EDRI, whose objective is to help improve the policy-making decision process in Ethiopia.